
Housing more, driving less
It’s pretty well established that building denser reduces vehicle travel and emissions, but there isn’t much work looking at the effects on housing availability independent of density.

Does greater housing vacancy reduce vehicle miles traveled (VMT) by allowing people to afford to live in a more optimal location?
I used census and bureau of transportation statistics data to compare VMT vs housing vacancy for 71000 census tracts, split by density decile, and the results actually look like something: Driving declines as vacancy increases, and the effect is way stronger for tight housing markets.
Diving deeper
It's pretty well-established that denser urban contexts reduce transportation demand and emissions, first by cutting the distance which must be traveled in order to reach jobs and amenities, and by shifting mode share away from personal vehicles. Zack Subin of Berkeley's Terner Center has done some good writing on this.
However, it stands to reason that housing availability can function in the same manner as density. When more vacant housing units are available to prospective residents, they have more options to find suitable housing in more optimal locations close to their desired destinations. In a highly constrained housing market, residents might be more likely to accept more costly and time-consuming commutes in exchange for better housing options.
While the density angle is well-documented by people like Subin, the availability dynamic is poorly characterized. The best work on this is probably that by Evelyn Blumenberg at UCLA, who found that commutes increase when there are more jobs than housing.
In comparing Los Angeles to other areas, Blumenberg found a significant relationship between commute distance and the distribution of jobs and housing in urban cores with critically low housing supply, but not in less-constrained suburbs. She also noted a stronger relationship in San Francisco than in Los Angeles, where housing availability is somewhat greater.
But her work was limited in geographic scope and focused on the comparative distributions of housing and jobs, rather than outright housing vacancy. To isolate a vacancy effect and control for density, I opted to compare estimates of household VMT produced by the Bureau of Transportation Statistics with vacancy data compiled by the US Census at the tract level.
The VMT estimates can be found here. These are modeled using household transportation survey responses for the year 2017.
Because housing tends to be especially constrained in dense urban cores where VMT also tends to be low, I binned census tracts by density decile in an attempt to isolate vacancy effects. I calculated linear models for each decile and plotted them:
There seems to be a consistent relationship: Vehicle miles traveled declines steadily as housing vacancy increases, and this appears to hold true at all density levels.
The correlation is also fairly strong, with R^2 for some deciles being in the 0.25-0.34 range. Interestingly, the correlation is weaker for the densest tracts; I suspected that this was because the nature of the link between VMT and vacancy changes as vacancy increases. Further, some ultra-constrained urban tracts (e.g. those in Manhattan) also have the best pedestrian and transit infrastructure, and people with the means to live there likely work nearby.
Because the relationship may change as housing availability increases, I split the data at various vacancy rate cutoffs and calculated the same linear models above and below those levels in order to look for an inflection point. I did this for vacancy rates from 4 to 16% in 2% increments:
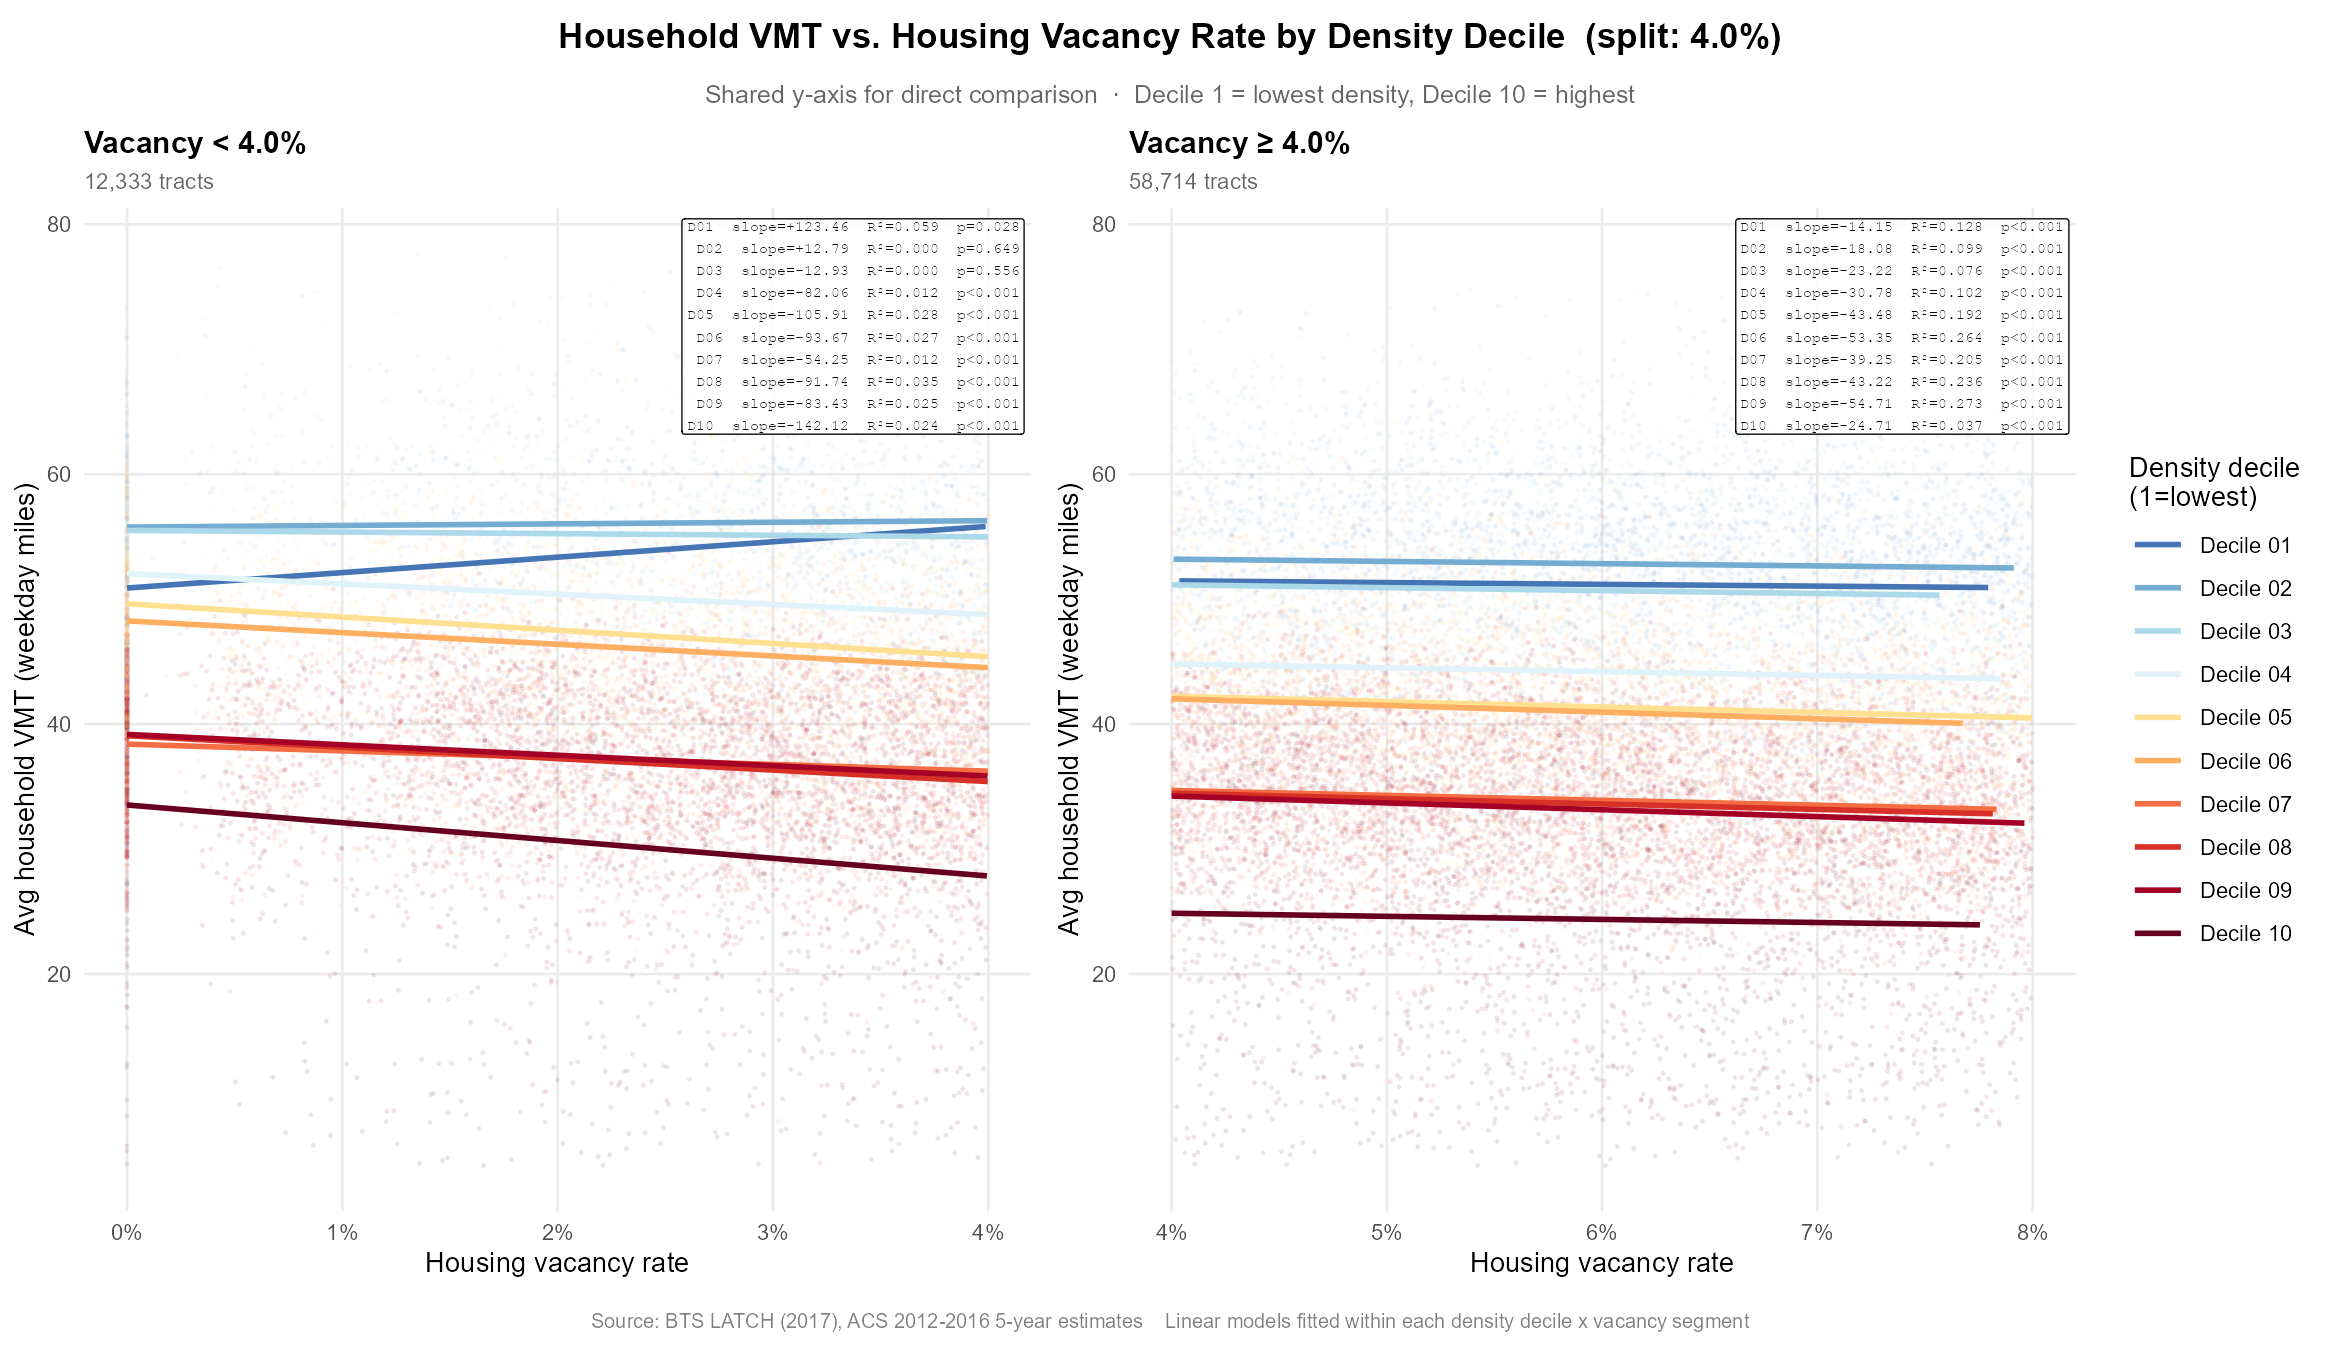
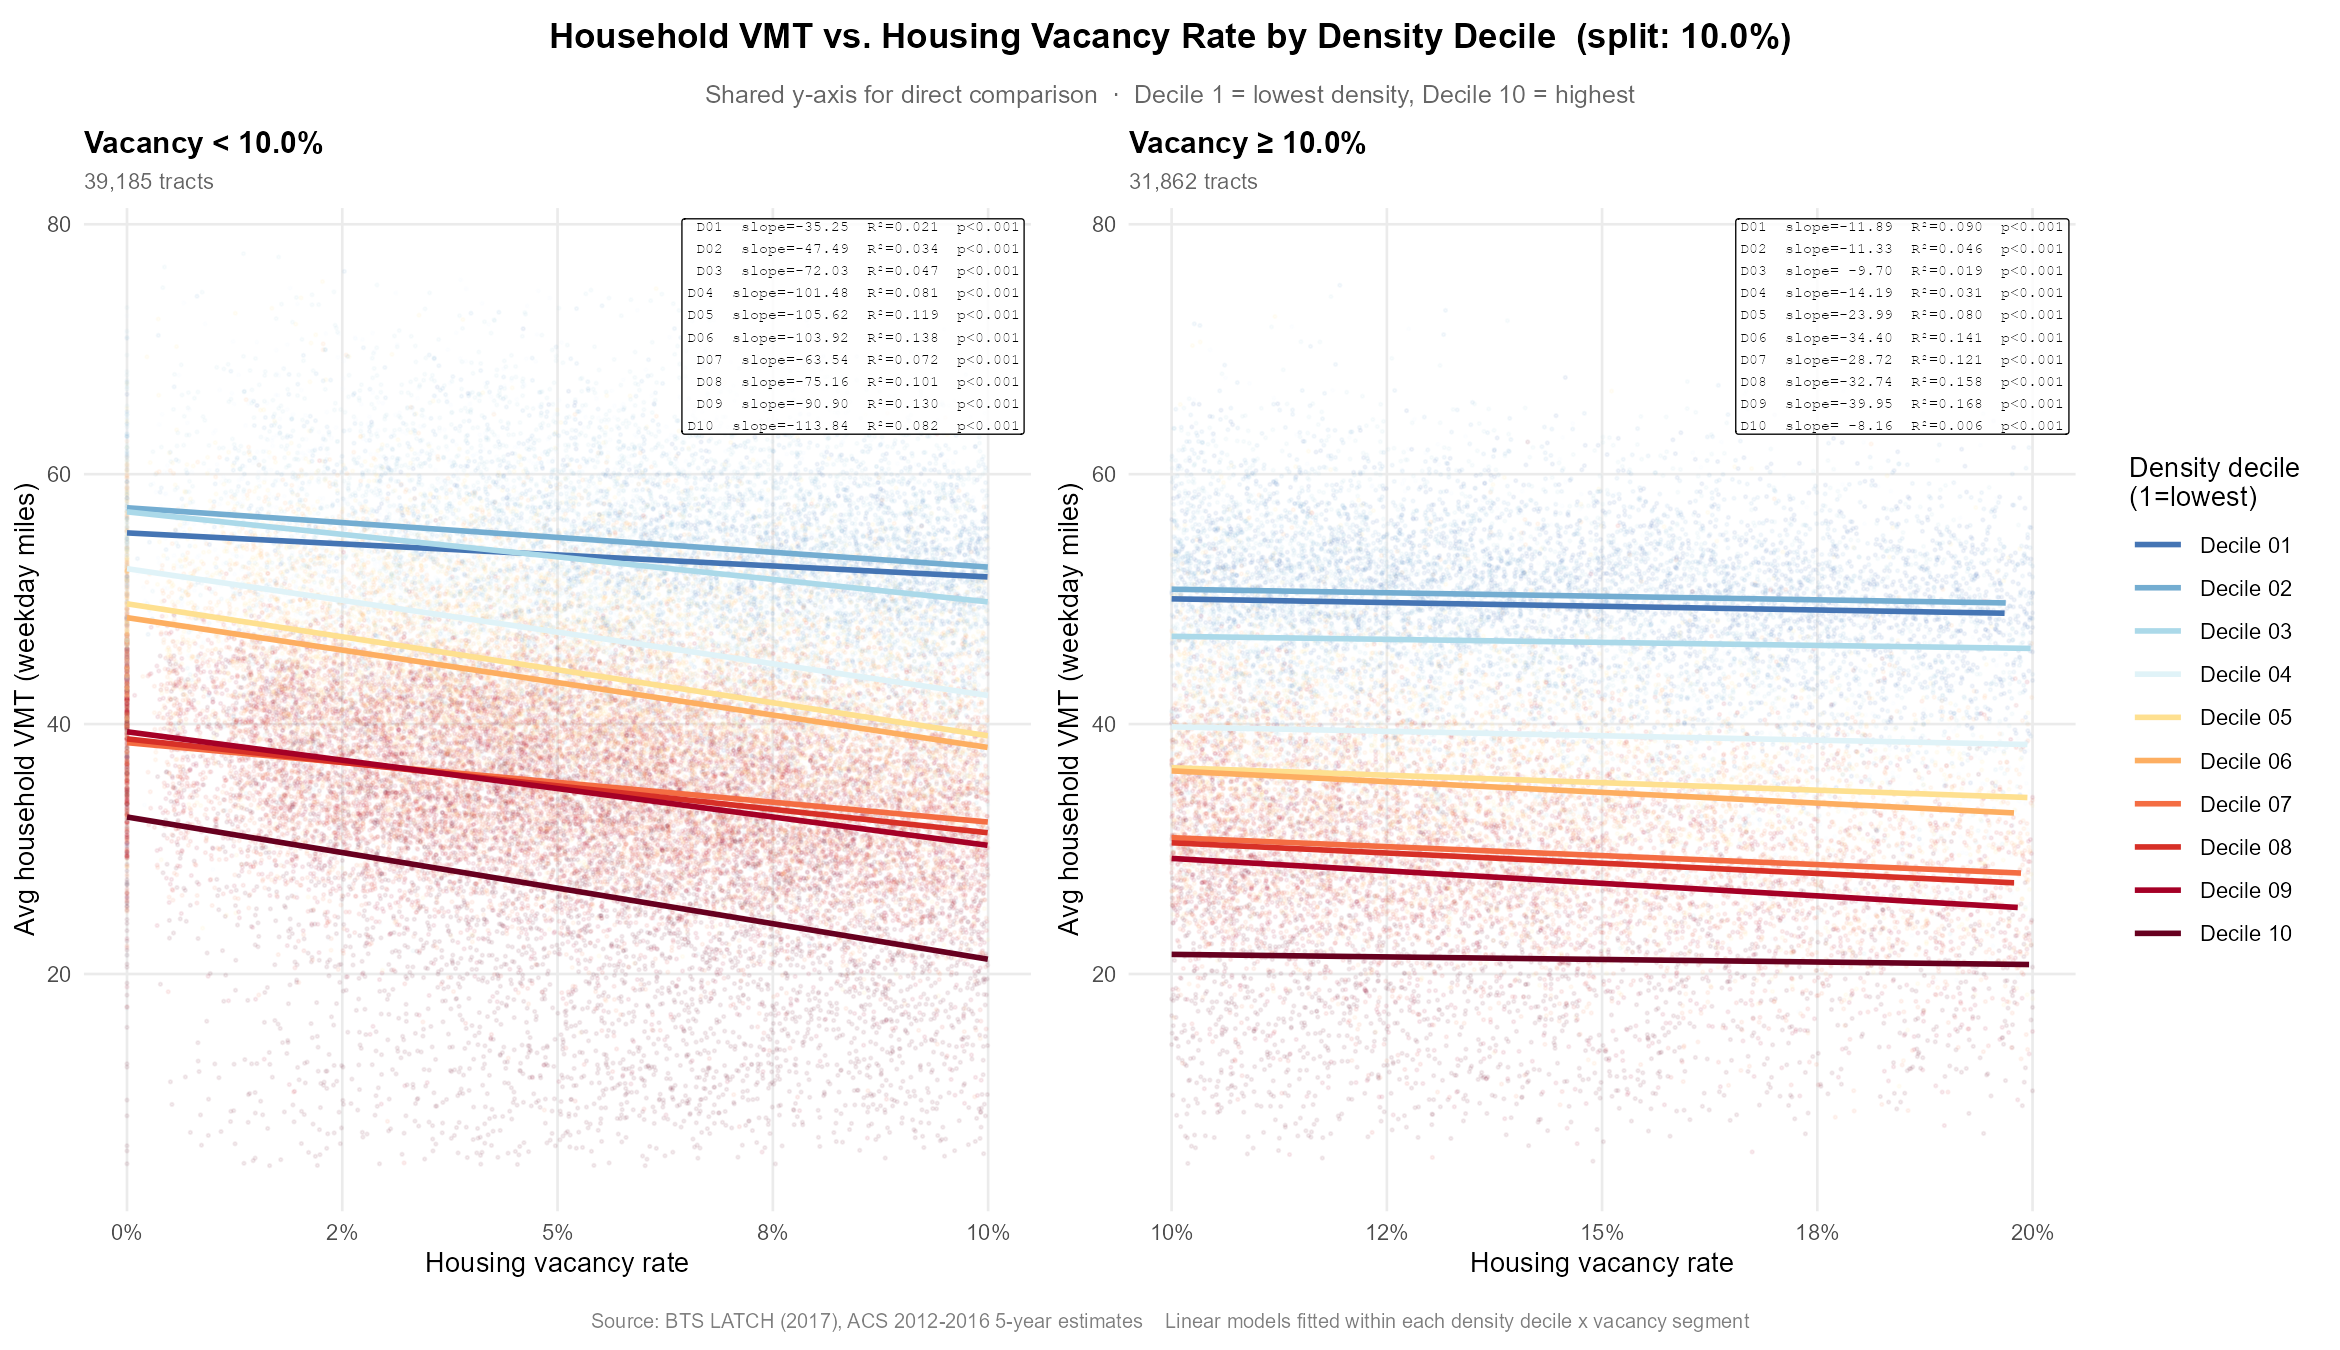
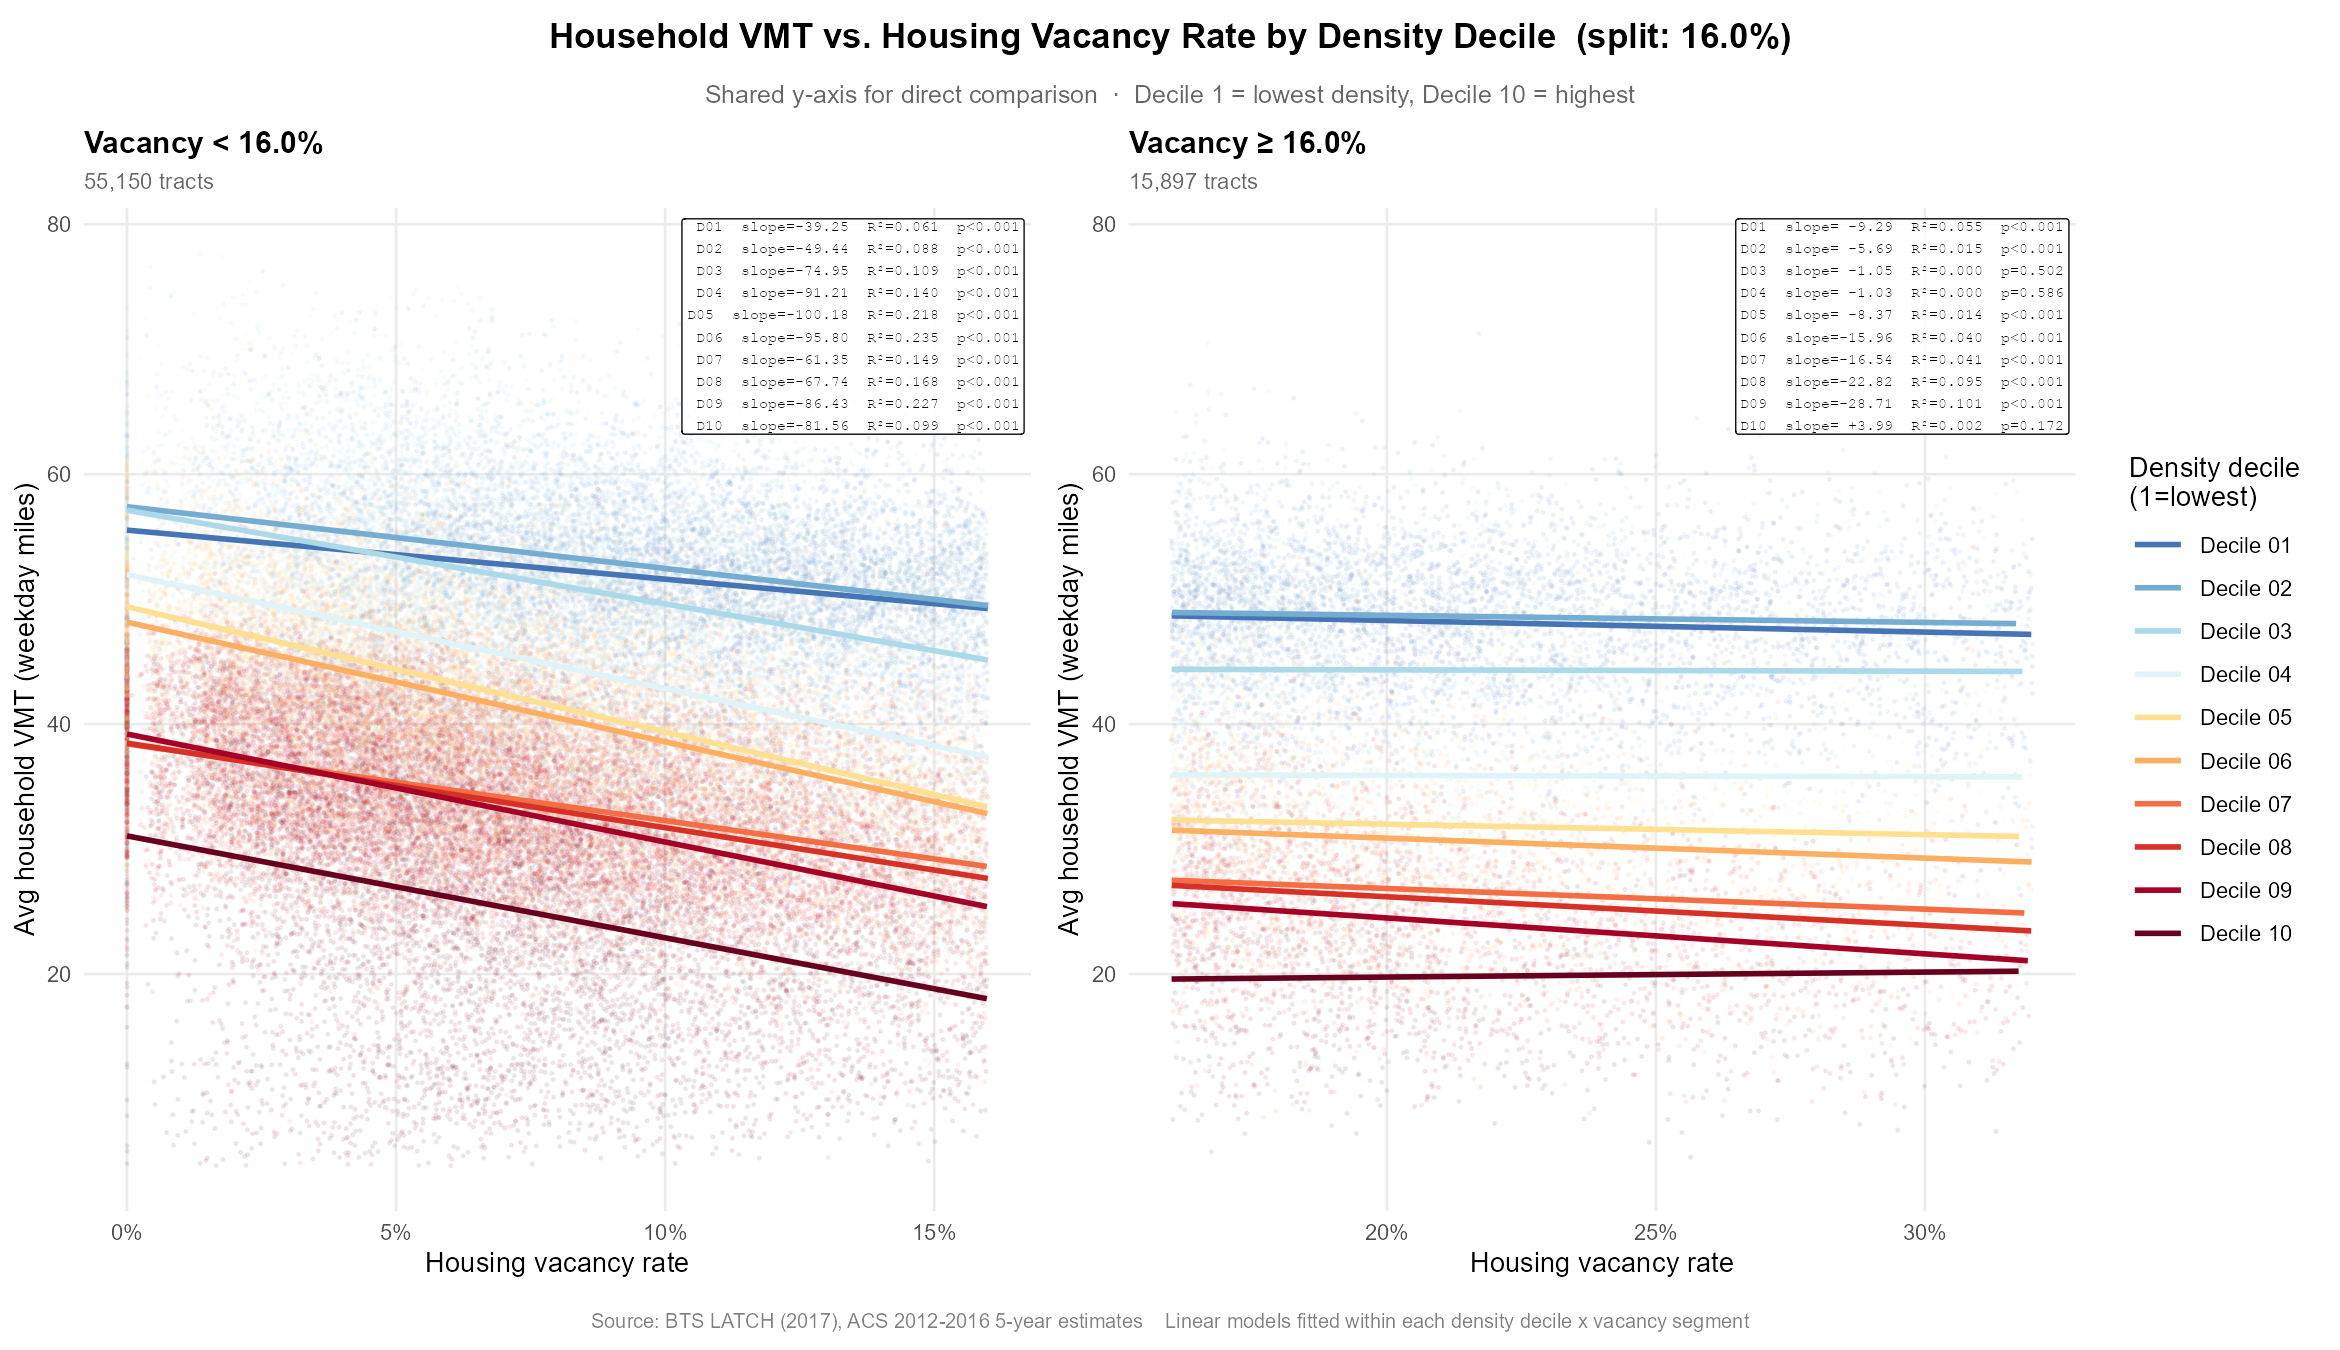
You can see that some of the models get messy at different cutoffs. There are, for instance, few low-density tracts with low vacancy and few high-density tracts with high vacancy, making models for those instances unreliable. A split at 10%, however, appears to show a strong negative relationship for tracts with vacancies below this level, and a virtually flat one for higher vacancies for most density levels. This would seem to suggest that, at vacancies below 10%, housing market pressure begins to force residents to seek a compromise between location and housing suitability, though the precise inflection point is likely different for the various density deciles.
I think these are cool initial results, but I'd also like to improve on my methodology.
It would also be helpful to bin tracts by household income to eliminate the possibility that these findings are a proxy for economic opportunity; that is, that housing vacancy and low VMT are both results of weak local economies (I do think this is plausible for tracts such as those in shrinking rural areas with extremely high vacancy).
Second, I would like to explore other VMT metrics. The BTS-LATCH dataset gives values for weekday travel at the household level, so it overrepresents commutes and does not account for household size (though this is relatively easy to adjust for). More importantly, it is itself a model, as it extrapolates from survey data (admittedly a very large survey, with 129,000 responses), meaning that these results are essentially models of a model. One way to produce reliable raw VMT might be to use DOT traffic volume data trimmed to census tracts using GIS.
Finally, I would like to account for outliers among high-density tracts, like the Manhattan example. The LATCH data do not show where people are commuting to from their respective tracts, which may understate the long commutes induced by housing shortages in urban cores, and inflate VMT for higher-vacancy neighborhoods outside of downtowns. I speculate that accounting for this could actually significantly strengthen these findings.
-ProHousing advocate Adam Cook